Monitoring Payout Reliability Across Betting Platforms: Essential Metrics and Methods
Written by Riley Koch · Oct 21, 2026
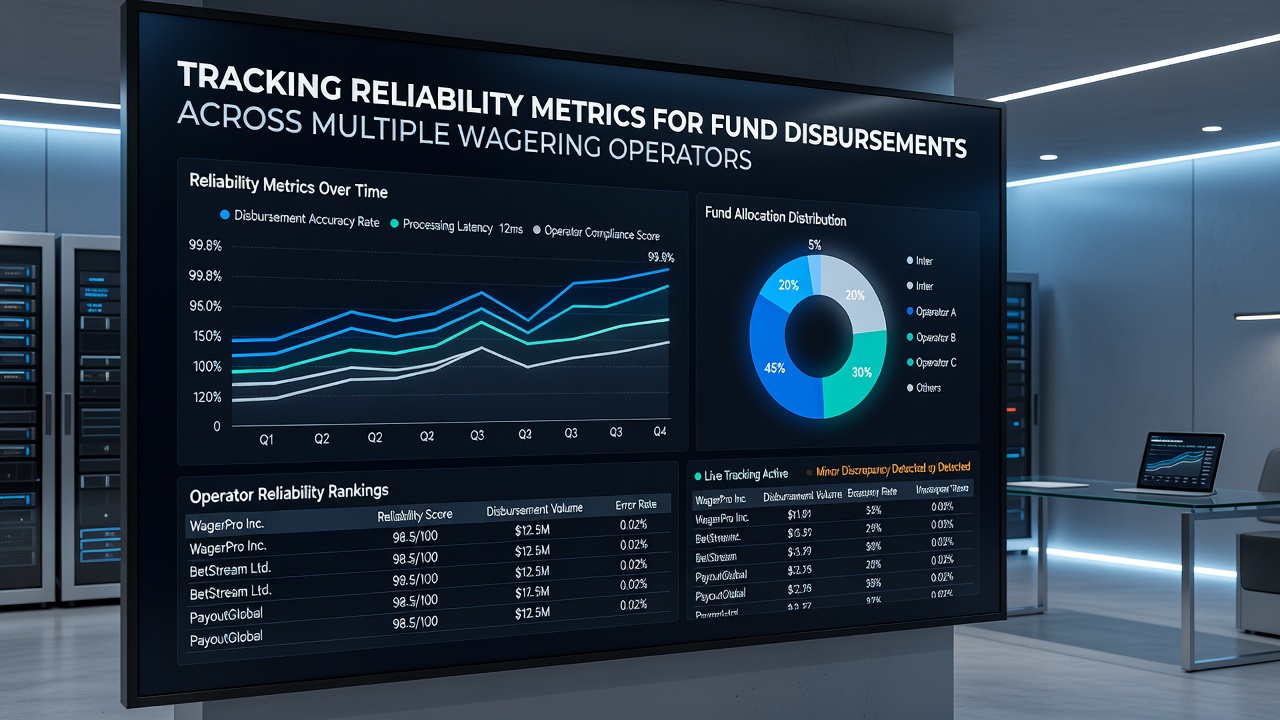
Monitoring Payout Reliability Across Betting Platforms: Essential Metrics and Methods
Operators handling fund disbursements must track specific metrics that reveal consistency in processing withdrawals across different platforms, and those metrics include average transaction completion times, approval percentages, and variance in daily volumes. Researchers have compiled data showing that platforms operating in multiple jurisdictions often publish aggregated reports on these figures, while individual operators maintain internal logs that regulatory bodies review during audits. Data from the Nevada Gaming Control Board indicates that monitored entities reported average payout windows ranging from 24 to 72 hours for verified accounts in recent quarters, and similar patterns appear in filings from other regions where electronic transfers dominate.
Core Metrics Used in Reliability Tracking
Success rate calculations form one foundation for evaluation because they measure the proportion of initiated withdrawals that reach completion without reversal or delay, and observers note that rates above 95 percent typically signal stable backend systems. Processing time distributions provide another layer since they capture not just the mean but also the spread of outcomes across thousands of transactions, revealing whether outliers occur during peak periods or after regulatory checks. Error frequency logs track instances where additional verification steps interrupt flows, and analysts combine these with volume data to identify seasonal spikes that coincide with major sporting events.
One study from a Canadian research institution examined operators licensed in Ontario and found that cross-platform comparisons highlighted differences in how quickly smaller versus larger disbursements cleared, whereas platforms using automated verification tools showed tighter distributions around their reported averages. Those who've reviewed such datasets often discover that combining success rates with time metrics creates composite scores that regulators and operators use for benchmarking performance across state lines and national borders.
Data Collection Approaches Across Jurisdictions
Operators collect raw transaction records through integrated software that timestamps each stage from request submission to bank confirmation, and they aggregate these records monthly for internal reviews before submitting summaries to oversight agencies. In October 2026, reports compiled by multiple North American regulators showed increased adoption of real-time dashboards that flag deviations from historical norms within hours rather than days, allowing quicker adjustments to verification protocols. Australian state agencies have implemented similar reporting requirements that emphasize geographic breakdowns, separating metrics for domestic versus international user bases to account for varying banking rails.
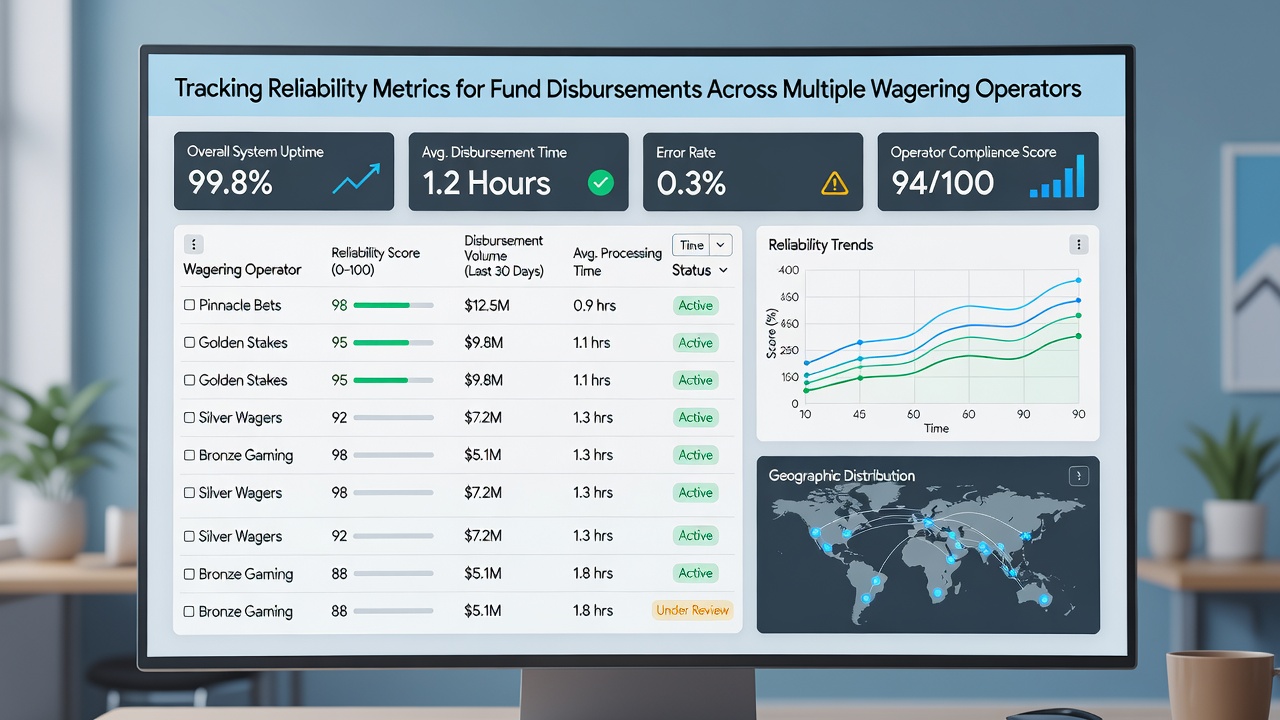
External audits supplement operator self-reporting because independent firms sample transaction subsets and recalculate key indicators to verify accuracy, and findings from these reviews feed into public summaries that bettors and analysts reference when comparing platforms. The European Gaming and Betting Association has published guidance documents outlining standardized categories for such metrics, which helps align reporting practices among operators active in several European markets simultaneously.
Integration of Metrics Into Operational Decisions
Platform teams review reliability metrics during scheduled meetings to adjust staffing levels for verification teams or to renegotiate terms with payment processors when persistent delays appear in specific corridors. Threshold alerts trigger deeper investigations once a metric crosses predefined boundaries, such as a sudden drop in success rates below 92 percent over a seven-day window, and these alerts often lead to temporary holds on high-volume accounts until root causes receive attention. Comparative analyses across operators reveal that those maintaining diversified banking partnerships tend to exhibit lower variance in completion times, particularly during periods of elevated transaction loads.
Academic papers examining wagering ecosystems have noted correlations between robust metric tracking and fewer customer complaints logged with regulatory portals, although causation requires further longitudinal study. Observers note that platforms sharing anonymized metric datasets with industry consortia contribute to broader benchmarks that emerging operators consult when designing their own disbursement workflows.
Conclusion
Reliability metrics for fund disbursements supply concrete indicators that operators, regulators, and analysts apply when assessing performance across wagering platforms. Consistent collection and review of success rates, processing distributions, and error patterns enable identification of systemic issues before they affect larger user groups. As reporting standards continue to evolve in various jurisdictions through 2026 and beyond, the emphasis remains on transparent data practices that support informed comparisons without reliance on subjective assessments.